A core economic indicator I have continually improving since November 2016 has been confidence. Animal spirits blowing strong.
See —> AtlantaFed Post
Atlanta Macroblog Post


| Population (2015 Estimates)[1] | |
|---|---|
| • Density | 630/sq mi (243/km2) |
| • Urban | 4,515,419 (9th) |
| • MSA | 5,710,795 (9th) |
| • CSA | 6,365,108 (11th) |


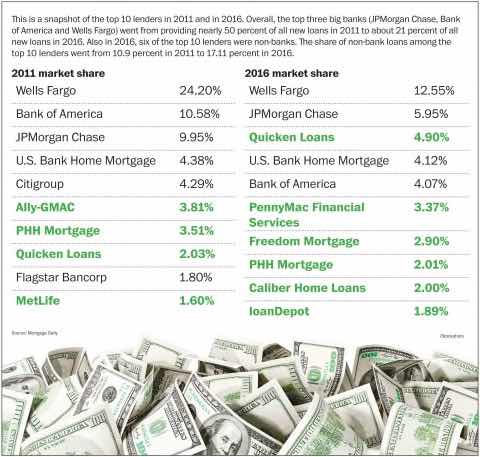
Above shows the change in mortgage underwriting - from banks to non-banks. Great read below, it includes the statement: Before the financial crisis, mortgages were the last thing a consumer would default on, Noring says. That flipped in 2009, when people started defaulting on their mortgages first,” he says. “That was a tsunami for everyone in the mortgage business, and we’re still seeing the fallout. Lenders were not prepared to deal with it and didn’t do a great job, plus new rules were coming out that they needed to follow.
I am an analyst by trade so I cannot help but think of market share and the changing landscape of various industries and industry segments. The mortgage industry has long been safe due to the various state laws and their difference in nature. The internet clearly shrinks that.
From American Banker The nonbank mortgage banks in question originate approximately 50% of all mortgage loans – representing a $1 trillion market this year alone. - Do brokers generate $50B in US mortgages? I am unaware of secondary market numbers so it is hard to assess. We will have more on the industry published later this month and next.

2016
|
2017
|
|||||||
I quarter
|
II quarter
|
I half
|
III quarter
|
9 months
|
IV quarter
|
Year
|
I quarter
|
|
at
current prices; billion roubles
|
||||||||
Gross Domestic Product at market prices
|
18815.9
|
20429.6
|
39245.5
|
22721.2
|
61966.8
|
24076.9
|
86043.6
|
20090.9
|
of which:
|
||||||||
final
consumption expenditures
|
14245.2
|
14497.0
|
28742.2
|
15203.7
|
43945.9
|
15876.8
|
59822.7
|
15064.1
|
households
|
10357.8
|
10553.8
|
20911.6
|
11218.7
|
32130.3
|
11811.1
|
43941.4
|
10976.7
|
public administration
|
3806.0
|
3860.7
|
7666.7
|
3901.6
|
11568.3
|
3981.1
|
15549.4
|
3995.6
|
non-profit
institutions serving households
|
81.4
|
82.5
|
163.9
|
83.4
|
247.3
|
84.6
|
331.9
|
91.8
|
gross capital
formation
|
2981.8
|
4422.6
|
7404.4
|
6440.8
|
13845.2
|
6286.9
|
20132.1
|
3033.5
|
gross fixed capital formation *
|
2907.9
|
3912.4
|
6820.3
|
4392.7
|
11213.0
|
6899.4
|
18112.4
|
3022.1
|
changes in
inventories
|
73.9
|
510.2
|
584.1
|
2048.1
|
2632.2
|
-612.5
|
2019.7
|
11.4
|
net exports of
goods and services
|
1326.3
|
1064.1
|
2390.4
|
712.4
|
3102.8
|
1335.7
|
4438.5
|
1720.0
|
statistical descrepancy
|
262.6
|
445.9
|
708.5
|
364.3
|
1072.9
|
577.5
|
1650.3
|
273.3
|
volume
indices; at constant prices,
percent of corresponding period of previous year |
||||||||
Gross Domestic
Product
|
99.6
|
99.5
|
99.5
|
99.6
|
99.6
|
100.3
|
99.8
|
100.5
|
final
consumption expenditures
|
96.7
|
95.5
|
96.1
|
96.3
|
96.2
|
97.5
|
96.5
|
102.1
|
households
|
95.7
|
94.1
|
94.9
|
95.2
|
95.0
|
96.8
|
95.5
|
102.7
|
public administration
|
99.6
|
99.5
|
99.5
|
99.5
|
99.5
|
99.5
|
99.5
|
100.4
|
non-profit
institutions serving households
|
100.8
|
100.7
|
100.8
|
100.7
|
100.7
|
100.8
|
100.7
|
100.0
|
gross capital
formation *
|
102.5
|
101.6
|
102.0
|
99.9
|
101.0
|
102.7
|
101.5
|
100.1
|
exports
|
99.7
|
104.9
|
102.3
|
104.2
|
102.9
|
103.7
|
103.1
|
107.1
|
imports
|
92.2
|
95.4
|
93.8
|
96.3
|
94.8
|
100.4
|
96.2
|
116.5
|

2016
|
2017
|
||||
II
quarter
|
III quarter
|
IV
quarter
|
I
quarter
|
II
quarter
|
|
percent of December of previous year
|
|||||
Consumer price index for products and services
|
103.3
|
104.1
|
105.4
|
101.0
|
102.3
|
food products (including alcoholic beverages)
|
103.2
|
102.4
|
104.6
|
101.2
|
103.4
|
non-food products
|
103.8
|
105.2
|
106.5
|
100.9
|
101.3
|
services
|
102.7
|
104.8
|
104.9
|
100.8
|
102.0
|